
Get found or get ignored
Deep tech’s search and AI visibility, ranked
What separates the most visible deep tech companies from the rest, across search and AI answers
Executive Summary
We audited 100 companies across five deep tech segments: Silicon & Semiconductor, Cloud AI, Physical AI & Robotics, Edge AI, and Quantum Compute. Each was scored 0 to 100 on how well its website performs for traditional search and for answer engines, the systems behind ChatGPT, Claude, Perplexity, Gemini and Google's AI Overviews.
Four findings stand out:
Deep tech performance is uneven, and that unevenness is the opportunity
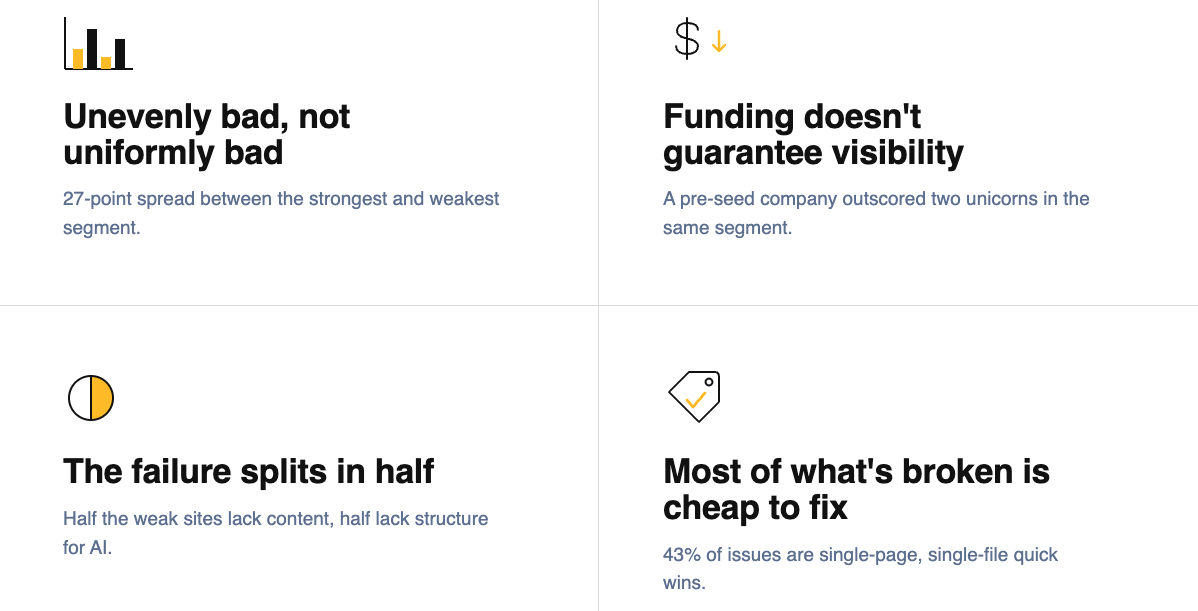
The average score across all 100 companies is 58 out of 100, a solid baseline. But that number hides a 27-point spread between the strongest segment (Cloud AI, average 69) and the weakest (Silicon & Semiconductor, average 43). A 27-point gap means a company in the weaker segments could roughly double a competitor's score with focused work, real ground to gain for whoever moves first.
Funding does not ensure visibility. Two humanoid robotics companies in this sample have raised more than a billion dollars between them. Both score in the bottom band. Meanwhile, a six-person pre-seed company in the same segment scores 78, ahead of most of its better-funded peers.
The failure splits almost exactly in half.
Of the 52 companies where we scored search and answer engine performance separately, 22 were weaker on answer engine readiness than on traditional search, and 22 were weaker on traditional search than on answer engine readiness. Eight were weak on both. There is no single fix that works across the sector, which is precisely why diagnosis matters before trying to blindly fix the problem.
Most of what is broken is cheap to fix.
Across 172 individual findings, 43% were classified as quick wins: single page, single tag, single file changes that a developer could ship inside a week. Only 19% were heavy lifts requiring sustained content investment.
What we measured
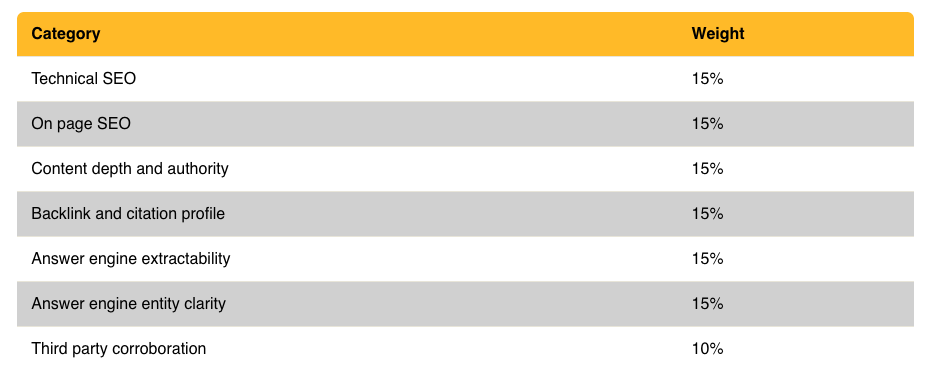
Every company was scored across seven weighted categories:
Score bands: 0 to 20 stealth, 21 to 40 thin or PR driven, 41 to 60 solid baseline, 61 to 80 strong, 81 to 100 comprehensive.
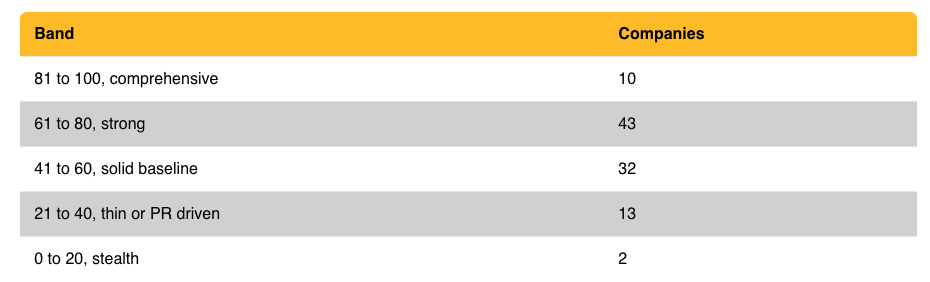
Across all 100 companies, the distribution looks like this:
Just over half the sector sits in the top two bands. That is better than the "deep tech is invisible" cliché suggests. The problem is not that most companies are bad, it is that there are very few standout performers. The companies that do stand out are deliberate about discoverability, treating it as part of core product and content strategy rather than an afterthought
Segment benchmarks
Across the 40 companies where we recorded findings at the individual issue level, 172 issues were logged. The pattern is consistent- The FAQ and direct answer number is the one to sit with. Answer engines work by extracting a specific claim in response to specific questions. A page that never states a fact in a self-contained sentence gives them nothing to pull from. Most deep tech marketing copy is written to build a narrative arc, which is exactly the wrong shape.
-
Average: 69
Sample: 17 companies
This is the strongest performing segment, and home to the highest scores in the study. Together AI (95), FlexAI (92) and Baseten (92) have the three best answer engine setups we found anywhere. All three publish a comprehensive llms.txt file, maintain built in comparison pages against named competitors, and back claims with named customer case studies. Lambda (83) goes a step further, using its llms.txt to explicitly disambiguate itself from AWS Lambda- It’s a small detail but one that helps AI crawlers by solving a real entity confusion problem.
The surprise is at the bottom. The three lowest scoring companies in this segment are Microsoft (39), Google (40) and NVIDIA (43). Their corporate sites are vast, but vastness works against extractability: we found no clear entity statements for a specific product line, no direct answer formatting, and content architecture designed for humans navigating a menu rather than a model retrieving a fact. Scale is not the same as clarity. It's worth noting this could cut both ways: sheer weight of content can act as brute force for AI crawlers, but only if that content is actively maintained rather than left to sprawl.Segment takeaway: The bar in Cloud AI has been set high by well resourced challengers. If you are a Series A or B company in this space, your competitors are already doing this properly and you are being compared against them (or not at all, which is an even bigger problem)
-
Average: 66
Sample: 16 companiesThe most complete dataset in the study and the sharpest illustration of the funding to visibility gap.
At the top, Sereact (83), Humanoid (80) and Levtek (78). Levtek is the standout story: a six person, pre-seed company in Malmö with a better structured llms.txt than most of the billion dollar companies in this report. It includes preferred summaries, exact specifications, and a full FAQ block. The catch is that none of that FAQ content appears anywhere on the actual web pages, so it's only visible to AI systems that read llms.txt, not to human visitors, not to Google, and not to anyone who'd cross check it against the live site. Levtek is scoring well by optimizing for a channel almost no one audits. That's a legitimate strategy while llms.txt stays unverified and lightly scrutinized, but it's also fragile: it leaves Levtek exposed if answer engines start weighting on-page content more heavily, or if buyers start comparing what ChatGPT tells them against what the website actually says, and pick up any discrepancies.
At the bottom, we found two companies who have raised over a billion dollars across two rounds with Wall Street Journal and TechCrunch coverage. One company’s entire website is two lines of text. One company has raised more than $100M and is reportedly seeking a billion more; Wikipedia currently carries a fuller description of what the company does than the company's own homepage.Segment takeaway: In a category where investors, press and prospective customers are all searching for you simultaneously, being unfindable is an active choice. Several companies here are making it.
-
Average: 63
Sample: 15 companies
Hailo (89) sets the benchmark, with a large multilingual llms.txt, an AI crawler aware robots.txt that distinguishes search crawlers from training crawlers, and a deep resource library organised by industry vertical. Minut (75) and Ambarella (72) follow.This segment produced the clearest example of a distinction worth understanding: BrainChip (63) does have an llms.txt. It is auto generated CMS output listing popup themes and slider taxonomies. The company's actual white papers and case studies are not in it. Having the file is a great start, but without maintenance and review to make sure the right content is being served through it, the impact is not being seen.
Segment takeaway: Edge AI companies tend to have real technical content and real customer deployments. The gap is almost entirely in packaging, not substance.
-
Average: 64
Sample: 16 companies
A wide spread, from Quantum Motion (88) at the top to Qruise (35) at the bottom. Quantum Motion was the only company in its cohort with an llms.txt, a public glossary with direct answer definitions, a clear entity statement and a peer reviewed publication surfaced on site. Infleqtion (83) and SeeQC (79) follow a similar pattern.The recurring weakness across this segment is a mismatch between press credibility and site credibility. Several companies here have coverage in the Financial Times, Bloomberg, the Wall Street Journal and IEEE Spectrum, but do not surface any of it as structured proof on their own domains. Oxford Quantum Circuits (62) has a $350M Series C and top tier press, alongside a missing meta description and no canonical tag.
Segment takeaway: quantum companies are unusually good at earning third party validation and unusually bad at capturing it. The assets already exist, but they're sitting on someone else's website. The hard part, earning the credibility, is already done. Structuring it on their own domain is comparatively easy work, which means the company that does it first gets a disproportionate edge over peers who are still relying on press mentions alone.
-
Average: 43
Sample: 32 companiesThe weakest segment by a wide margin, more than 19 points below the next lowest. The top performer, lowRISC, scores 70. Nine companies score below 40. Two score below 20.
We are deliberately not drawing failure mode conclusions for this segment. Only two of the 32 companies here were audited with the newer methodology that separates search performance from answer engine performance, so any claim about why Silicon underperforms would rest on a sample of two. What the overall scores do support is the simple observation that this segment lags, consistently and substantially.
Segment takeaway: the bar in silicon is low, which cuts both ways. It is a weakness across the sector and an opening for any individual company willing to move first and stay ahead. High variance paired with low overall performance is a real invisibility risk for many companies here, most of whom are already resource-constrained in marketing. But it also means the opportunity to win is unusually cheap to capture, if companies treat discoverability as a real priority rather than an afterthought.
Cross segment findings
Two failure modes, and neither dominates. The underperforming sites in this study fail in one of two ways.
Mode one: Nothing worth finding. The content is thin, absent, out of date, or entirely press release driven. There is not enough fresh content for a search engine to rank or an answer engine to cite.
Mode two: something worth finding, but not findable. Real technical depth exists but is packaged so that machines cannot extract it. No llms.txt, no structured data, no direct answer formatting, with helpful context buried in marketing fluff. For instance, one Quantum Networking company has coverage in Bloomberg, the BBC, Forbes, IEEE Spectrum and The Economist alongside a six page site architecture and an underperforming homepage title tag. This example is typical; strong content, weak technical discoverability.
Among the 52 companies with detailed scoring, these split almost exactly evenly: 22 weaker on answer engine readiness, 22 weaker on traditional search, 8 weak on both. Which mode you’re in matters commercially. A company in mode one needs a content program, which typically will require more investment in time and resource with good quality content writers. A company in mode two needs a technical and structural intervention that might take a fortnight, but could deliver meaningful uplift in discoverability from existing content while providing the technical structure to use with future content. Applying the wrong remedy wastes the budget entirely, which is the argument for diagnosing before spending.
What’s actually missing, in order of frequency
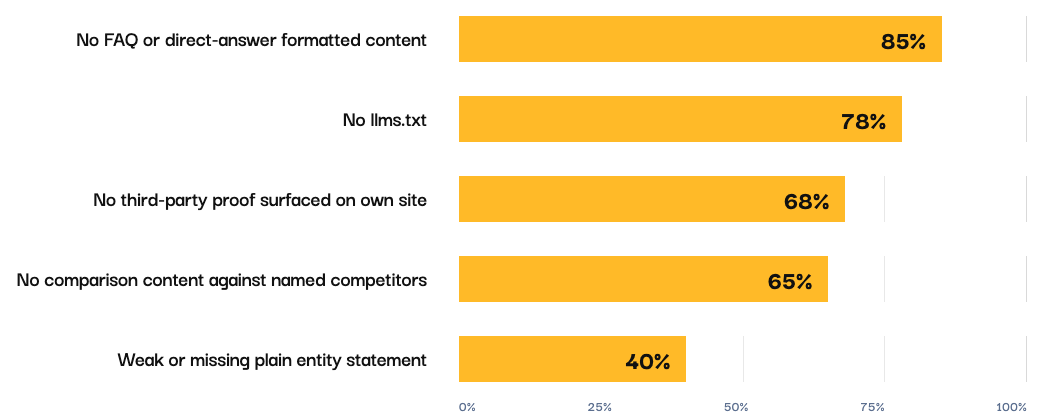
The comparison content gap is the most commercially expensive. Two thirds of these companies publish nothing addressing the comparison their buyers are actively making. When a prospect asks a model "how does X compare to Y", the answer gets assembled from analyst posts, forum threads and competitor pages. The companies that do publish comparison pages, notably Together AI, FlexAI and Baseten, are supplying that answer themselves and reaping the benefits.
And the best bit: Most of this is cheap to fix
Of the 172 findings:
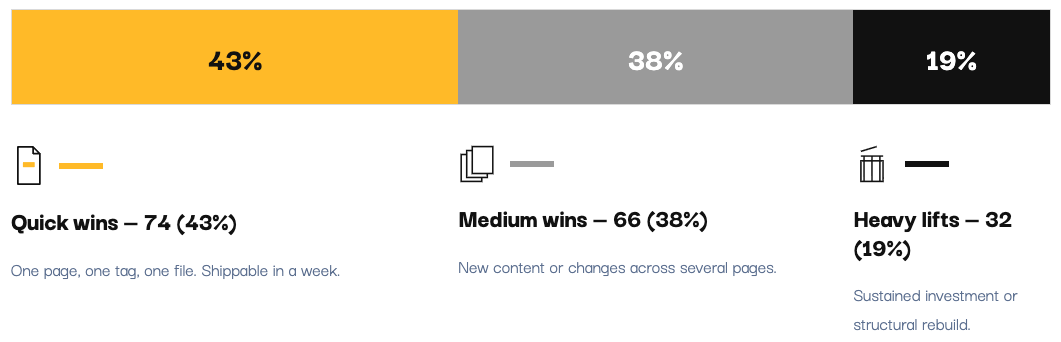
The single most common quick win in the entire study is publishing a well structured llms.txt. For a company that already has good technical content, that is an afternoon of work that materially changes how answer engines read the site.
What to do with this information
If you recognise your company in the numbers above, the useful next question is not "how do we compare" but "which of the two failure modes are we in, and what specifically is broken".
That is what a Signal Check answers. It is a company-specific version of the audit behind this report: your score across all seven categories, your findings split into quick wins, medium wins and heavy lifts, and a clear picture of whether your problem is content or packaging.
Book a surfacing call to get your score, and discuss how we can improve your inbound leads.
Latent Consulting is the translation layer between what you build and what your market understands. We work with deep tech companies across silicon, AI compute, quantum and emerging compute.